Mission

The mission of the Department of Computer Engineering and Sciences is to prepare computing, engineering and systems  students for success and leadership in the conception, design, management, implementation and operation of complex engineering problems, and to expand knowledge and understanding of computing and engineering through research, scholarship and service.

Electrical and Computer Engineering

Electric Vehicle


Team Leader(s)
Derek May

Team Member(s)
Ankit Dhadoti, Zexin Huang, Elis Karcini, Jacob Lovisone, Alejandro Loynaz, Matthew Mangsen, Purnjay Maruur, Jimmy Sabbides, Nevaeh Spera, Shawn Steakley, Jian Wang, Wen Wu

Faculty Advisor
Lee Caraway


Electric Vehicle  File Download
Project Summary
Our team is working on advancements in electric vehicles. Electric Vehicles are an important technology, which is still maturing. The associated control systems are often complex and proprietary. This allows Electric Vehicle manufacturers to charge exorbitant prices for replacement components. In years to come, our project aims to alleviate this issue by making electric car technologies more accessible by developing a fully open-source motor control system. To expand, this year we aimed to develop the traction inverter. A traction inverter is one of the three main components in an Electric Vehicle. It converts raw DC power from an Electric Vehicle's battery into usable AC power that the electric motor or motors can actually use. It is also responsible for controlling motor speed and torque, making it essential for efficient vehicle operation. This year, we have made custom hardware like a gate driver, brake coil circuit, and signal generator, among many other advancements. All together, we have successfully created a fully functional traction inverter. Using the knowledge gained in power electronics and embedded systems from our courses. We were able to solve real design challenges and create a foundation that future teams can use to take Electric Vehicle access to the next level.


Project Objective
The objective of this project is to create a robust system for driving a 3-Phase AC electric motor. Generally speaking, to drive this type of motor, it is necessary to control the 6 MOSFETs of a 3-Phase inverter in a precise pattern known as SPWM. This requires a well-programmed microcontroller, gate drivers for the MOSFETs, and MOSFETs capable of withstanding the intended operating conditions.


Specification
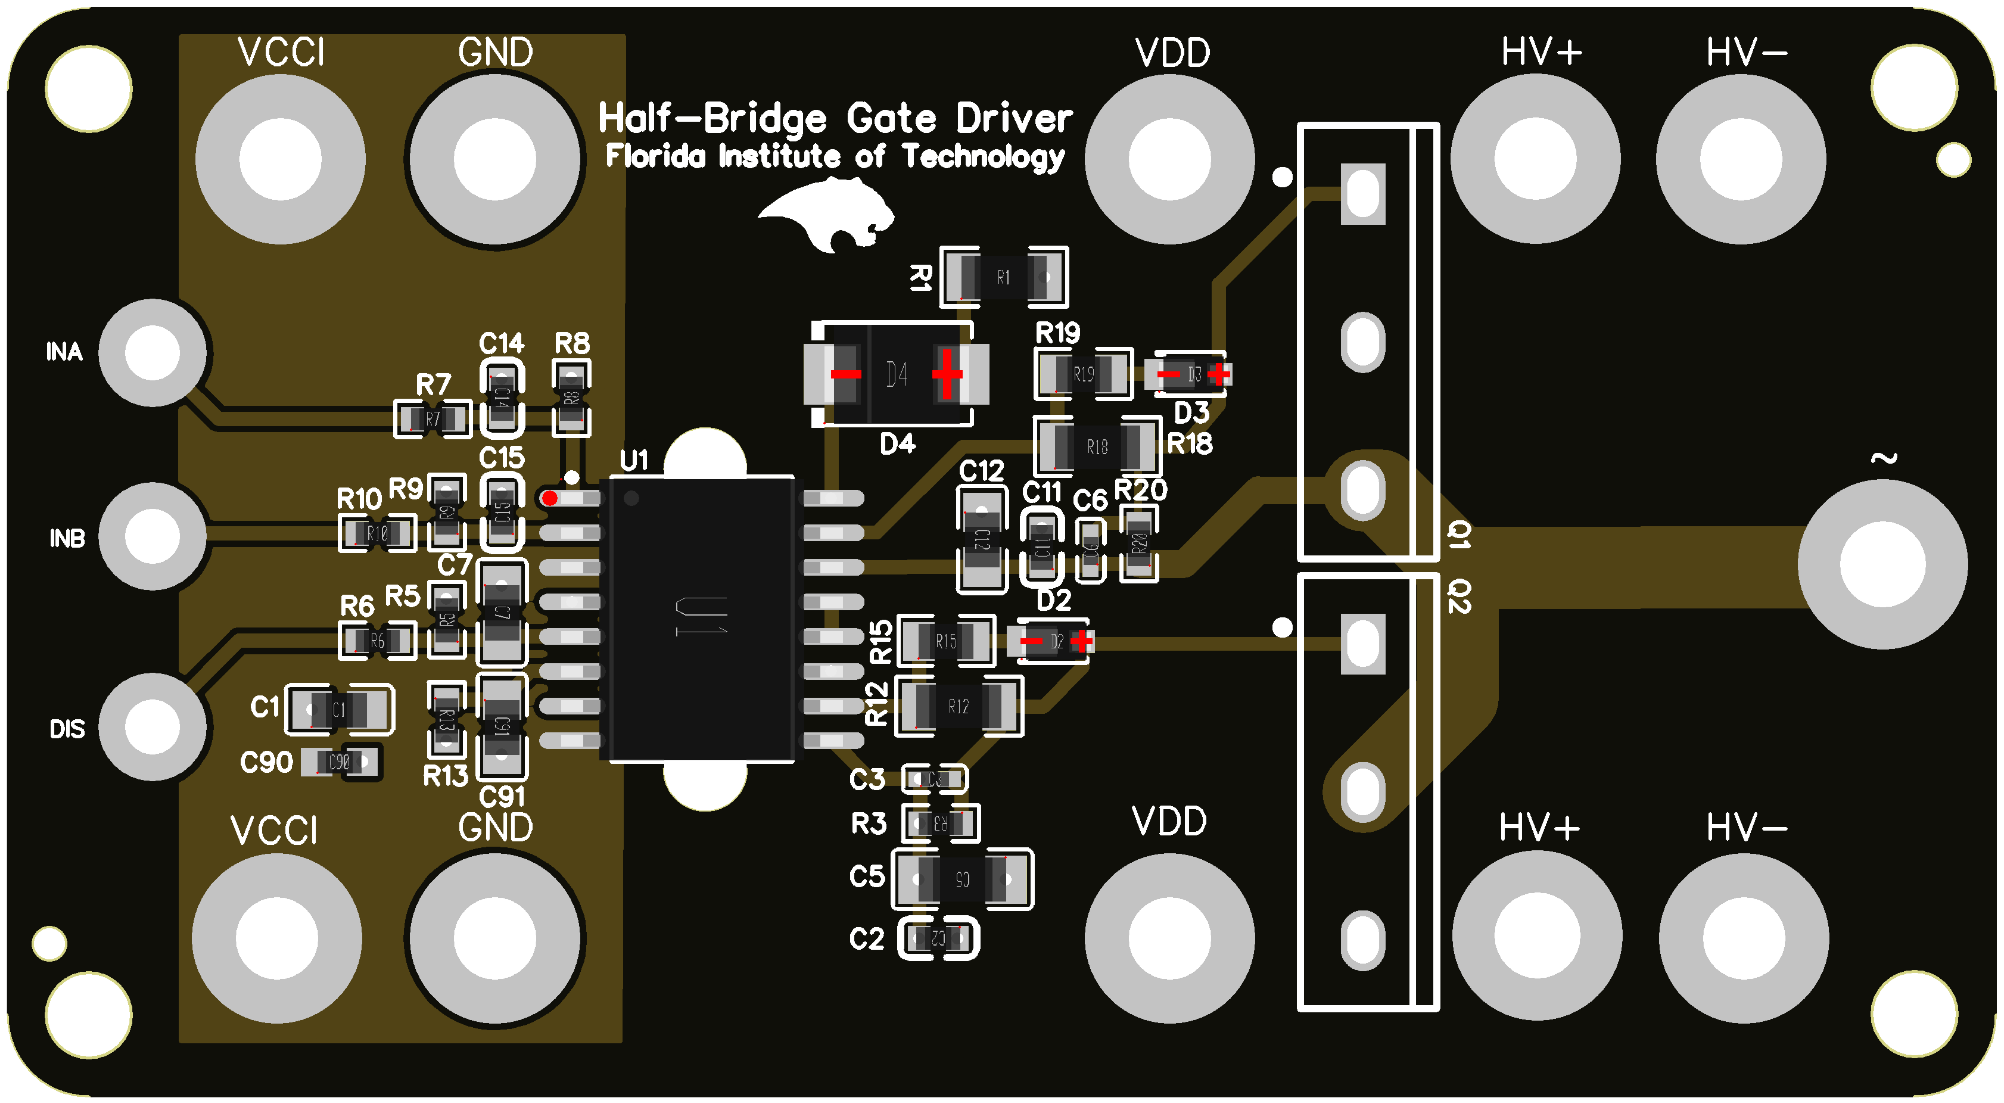
The three phases of a generic AC motor are three sine waves, each 120° phase-shifted. Complexity is introduced when we must generate these waves at a high voltage using the on-off nature of MOSFETs. The common method, SPWM, uses a shifting duty cycle on a high-frequency square wave to emulate a smooth sine wave. To generate this signal with sufficient speed, we must tap into the timers and registers of the microcontroller. Therefore, we have currently dedicated a separate piece of hardware to this process which we call the Deterministic Function Generator (DFG). With very little spare processing capacity on the DFG, we decided to handle I/O and PID on a Raspberry Pi. This also allowed us to create a graphical user interface instead of maintaining and updating physical I/O hardware. MOSFETs require current to flow into and out of the gate to open and close the source-to-drain path. We prefer to drive the gate with around 12V. This becomes more challenging due to the complexity of the SPWM signal. Microcontrollers alone are not designed to output 12V at sustained currents. Thus, we need a circuit specifically designed to convert 0V and 5V to ground and 12V respectively. This circuit board is a major contributor to the project’s complexity and is called the Half-Bridge Gate Driver. The FANUC motor has a normally-closed brake which is opened by an electromagnet. We developed and printed a circuit board designed to disable the brake, allowing the motor shaft to turn freely.

Analysis
This year, we focused on proving that the goal of our project was possible. From custom PCBs to complex code, we have many things to show for our efforts. Along the way there were countless times when one small detail made it difficult to proceed. We had to change our strategy along the way to adapt to emerging challenges. By the end, we proved that simplifying proprietary EV/HEV technology is possible. This was a feat not done by any previous team. We hope that this acceleration in progress helps and inspires future teams to pick up our torch, and carry it forward.

Future Works
We have gained extremely valuable knowledge about how future teams should move forward. By leading the next team in the right direction, we are confident in their ability to make better-informed decisions. In the latter stages of our project, we have dedicated time towards setting up the next team for success in the form of documentation and lab tune-ups. We suggest that future teams work on a more robust microcontroller system with proper I/O. We also suggest looking into improving the gate driver circuit to reduce sources of noise. Finally, we suggest running PCB simulations with high voltages to prove the circuit’s worthiness and safety.


Micro-Gravity: 3D Clinostat


Team Member(s)
Camden Bell, George Jekov

Faculty Advisor
Dr. Palmer

Secondary Faculty Advisor
Dr. Caraway


Micro-Gravity: 3D Clinostat  File Download
Project Summary
The microgravity simulator is a clinostat that rotates around two axis to simulate weightlessness in three dimensions. Experiments on the ISS and many advanced clinostats are costly and space limiting, which presents the demand and need for a more affordable benchtop microgravity simulator for research as well as teaching. This project aims to meet this demand by using Arduino Nanos, Arduino compatible parts, and a 3-D printed two frame clinostat.


Project Objective
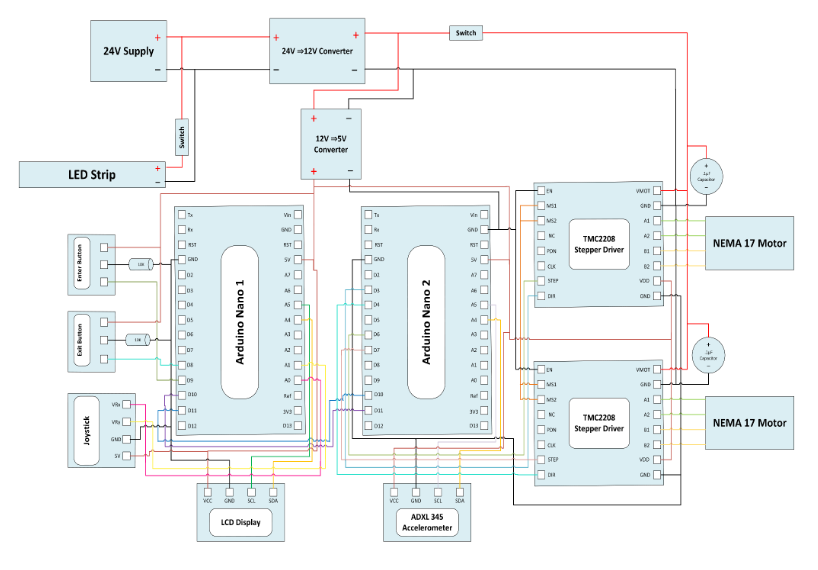
The objective of this project was to expand on the previous iteration by implementing an accelerometer and implementing a display interface. Inconsistent rotation speeds requires the use of an accelerometer so that it can be automatically corrected by system. The display interface is for users to be able to interact with the clinostat as well as read information pertaining to it.


Future Works
Future work includes but is not limited to including an enclosure dome to limit external stimuli, eliminating individual plate movement with a payload upgrade, and implementing a thermocouple to monitor the clinostat's temperature.


Ortega Observatory Rebuild


Team Leader(s)
Lennox Krell

Team Member(s)
Samuel Langborgh, Brandon Fulcher, Landon Schreck, Andrew Kelly, Gavin Wessel, Ian Houston, Jacopo Ghezzi, Cole Higbee, Justin Mangsen, Kellen Lucchesi , Scott Trauger, and Lennox Krell

Faculty Advisor
Dr. Lee Carraway


Ortega Observatory Rebuild  File Download
Project Summary
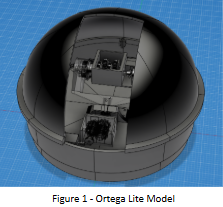
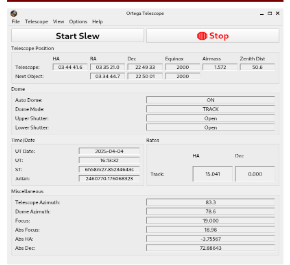
The first of our effort involved the star tracking capabilities of the telescope. The Ortega GUI aims to replace the outdated software which ran on a Windows Vista PC. We collaborated with astronomy professors to identify which user controls and feedback data are necessary for operating the telescope, and we implemented these requirements using Python with PyQT6 and Astropy. Our system takes astronomical coordinates as input, displays a preview of the object, and sends that data to the telescope over the network. The telescope will then track and image the object in the sky. Next we wanted to create a scale model to validate the GUI as well as any future work on the control system. Ortega Lite aims to model the Ortega Observatory at a 1:12 scale. It is designed to retain the same gear ratios which models the control feedback loop as closely as possible. The majority of the Ortega Lite is 3D printed, and uses stepper motors that are controlled by a Raspberry Pi. The Ortega Lite can be used as a test bench for future work on the observatory’s control systems.


Project Objective
Our goals included the following: Design a new Graphical User Interface (GUI), allowing remote control and operation of the telescope Manufacture a 1:12 scale model of the Ortega Observatory, enabling streamlined validation of all control systems Perform necessary maintenance and repair on the observatory and any supporting systems


Future Works
Using the Ortega Lite as a starting point, next years group can now freely validate a control system and prepare it for integration with the real Observatory. At that point, the focus can shift to capturing star image data and realizing full functionality. In addition, continued maintenance is required such as greasing the dome rails and telescope cable management.


GrandMaster ChessBot


Team Leader(s)
Isabelle Hudgins

Team Member(s)
Isabelle Hudgins, De’Marco Anderson, Wilson Burgos, Adam Guziczek, Ali Hussain, Gabriella Marrero, Isabela Perdomo, JiaJun Wu

Faculty Advisor
Dr. Lee Caraway


GrandMaster ChessBot  File Download
Project Summary
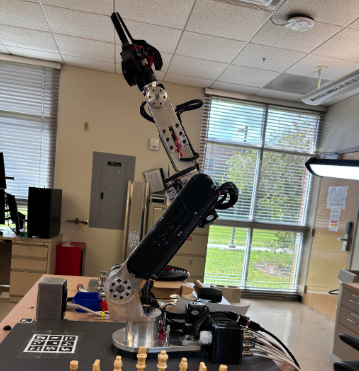
The GrandMaster ChessBot Project aims to create a safe and user-friendly experience with a robot that plays chess against the user. The system integrates various components, including a robotic arm, custom software, chess engine, clock, computer vision, and GUI to create this seamless experience. The game begins with a single button press on the custom GUI dashboard. The system then updates the game state and triggers a response from the AR3 robot, which plays its move using a machine learning model. Then, the user plays their move on the board and presses the clock to signal the end of their turn. The game will go on like this until the game is won or an illegal move is made. Computer vision monitors the board in real time, ensuring accurate move execution and safety. All actions are reflected on the dashboard, allowing seamless, intuitive interaction without direct control of the robots.


Project Objective
Improving Computer Vision: More extensive and varied data was collected and augmented to improve the accuracy of the computer vision. Dynamic Chess Player Code: The software that handles the chess engine and gameplay was refactored to a behavior tree, allowing for more dynamic gameplay, better scalability, and more ease should more behaviors be incorporated. Dashboard Completion: Front and Back ends of the dashboard were completed, connected, and improved to allow for user control of a game.

Manufacturing Design Methods
Hardware Overview: ChessBot Automated: A modified version of the AR3 from Annin Robotics that plays chess independent of user control. Clock: A custom chess clock that communicates with the computer system over serial Gripper: A gripper designed to pick up chess pieces, with an inbuilt depth camera for visual serving Software Overview: ROS2 (Humble): The Robot Operating System is a set of libraries that allow high-level composition of software components for robots Cyclone DDS: An implementation of the Data Distribution Service that enables communication between components, even across networks MoveIt2: A motion planning platform built on ROS2 ChessBots’ Firmware: A custom firmware was written for the ChessBot to take advantage of our hardware improvements and better integrate with MoveIt2 Pose Correction: An evolutionary algorithm is used to visually estimate drift in joint angles and correct them OpenCV: Used to calculate the positions of objects seen by the Kinect and identify chess pieces with the gripper’s depth camera PyTorch: Neural networks were trained to classify chess pieces and identify obstacles above the board Dashboard: A web-based frontend and backend communicate over WebSockets to relay data back and forth and interface with ROS


Future Works
Complete AR4 User Controlled Arm: The team began construction on an AR4 arm meant to be controlled by the user to play against the autonomous robotic arm player, but this was not completed. AI Chess Engine from Scratch: Currently, we use a ported chess engine, but a future group could develop their own AI powered chess engine that can learn from itself and become more varied in move choices and less predictable.


Acknowledgement
We would like to thank everyone who helped us during this process. Our team received support throughout the year from current junior design students and team members from previous years. We also could not have done this without the help of our GSA, Adrianna Agustin.


AARTS


Team Leader(s)
Cade Miles

Team Member(s)
Cade Miles, Jackson Jurevich, Benjamin Stompor, Colton McReynolds

Faculty Advisor
Dr. Lee Caraway


AARTS  File Download
Project Summary
A fully modular recon and support drone that can travel with and provide support to tank units and infantry divisions. The drone will be sent from its armored vehicle or infantry unit where it will be controlled by an operator. The image capture system will collect visual and LWIR thermal data which will be fed to a learning model to identify the target. If the operator is in a turreted vehicle, they can use the drone's laser range finder to help adjust turret rotation. The position of the target will be triangulated, and the turret will move accordingly.


Computer Science and Software Engineering

PantherFIT


Team Leader(s)
Zachary Geelalsingh

Team Member(s)
Melanie Heetai, Zachary Geelalsingh, T'Avion Rodgers, Zion Taylor

Faculty Advisor
Dr. Fitzroy Nembhard

Secondary Faculty Advisor
Dr. Chan


PantherFIT  File Download
Project Summary
PantherFIT is a mobile fitness application designed to enhance the gym experience for users at the Clemente Center. Developed with a mobile-first approach using React Native, the app offers personalized workout recommendations, instructional video demonstrations, and intuitive workout tracking. Novel features include real-time gym occupancy updates powered by Google’s location API and a badge system that rewards user consistency and progress. PantherFIT empowers users with smart tools to stay motivated, train effectively, and make the most of their gym visits on both iOS and Android platforms.


Project Objective
The objective is to develop a mobile application that enhances the gym experience by providing personalized workout plans, instructional exercise guidance, real-time gym occupancy data, and progress tracking tools. This solution aims to reduce user frustration, improve workout efficiency, and support long-term fitness engagement through accessible, data-driven features.

Manufacturing Design Methods
Agile Development: PantherFit follows an iterative Agile approach, allowing for continuous user feedback, feature refinement, and rapid updates throughout development. React Native Framework: The app is built using React Native for efficient cross-platform deployment on both iOS and Android devices. Modular Architecture: The system is designed with modular components (e.g., user profile, workout planner, badge system) to allow independent testing, scaling, and maintenance. API Integration: Google’s Location API and AWS backend services are integrated to provide real-time data, user authentication, and secure cloud storage.


Future Works
Integrate Wearable Devices: Sync with smartwatches and fitness trackers to enable automatic workout logging and real-time health metrics. Implement Social Features: Add community-based features like workout challenges, friend groups, and leaderboards to boost engagement. Expand Personalization: Use machine learning to refine workout recommendations based on user behavior, performance trends, and feedback.


Acknowledgement
We would like to sincerely thank Dr. Fitzroy Nembhard for his invaluable advice, encouragement, and continuous support throughout the year. His insights and mentorship played a vital role in shaping our project. We are also deeply grateful to Dr. Chan for his guidance and thoughtful feedback, which helped us stay focused and navigate each phase of this project successfully.


Sudoku Solvers


Team Leader(s)
Alice Luce

Team Member(s)
Alice Luce, Michael Richards, Jaden Krekow, Adrian Rodriguez

Faculty Advisor
Dr. Mohan


Sudoku Solvers  File Download
Project Summary
An application that solves Sudoku boards using different algorithms and visualizes how the algorithms operate to solve the board.


KitchenSync


Team Leader(s)
Chris Nederhoed

Team Member(s)
Chris Nederhoed, Tyler Son, David Tran

Faculty Advisor
Dr. Fitzroy Nembhard

Secondary Faculty Advisor
Dr. Philip Chan


KitchenSync  File Download
Project Summary
Project Summary: KitchenSync—A Smart Pantry and Meal‑Planning Companion KitchenSync brings together inventory management, recipe discovery, and meal planning into a single, user‑friendly desktop application. Designed for home cooks, busy families, and students, it solves the common “kitchen chaos” problems—forgotten perishables, fragmented recipe tools, and last‑minute grocery runs—by offering: Seamless Inventory Tracking Add ingredients via manual entry, barcode scans, or receipt uploads (Tesseract OCR + Pyzbar). Organize items by location (Fridge/Freezer/Pantry) and custom tags (e.g., “Expiring Soon,” “Dairy”). Comprehensive Recipe Management Create, store, and share recipes with step‑by‑step instructions, images, equipment lists, nutrition data (USDA API), and flavor‑pairing recommendations. Filter and browse a community library by dietary tags, cost, time, and complexity. Intelligent Meal Planning Drag‑and‑drop recipes into day/week/month views with distinct prep, passive, and cook phases. Instantly see “What Can I Cook Now?” based on real‑time inventory, and receive alternative suggestions when ingredients are missing. Under the hood, KitchenSync uses Java 17 + JavaFX for its desktop UI, Python microservices for OCR and barcode decoding, and AWS DynamoDB for secure cloud storage. RESTful integrations with Open Food Facts and price‑scraping modules provide up‑to‑date product and cost data. Early evaluations show  80 % receipt‑scan accuracy, average UI response


Specification
Supported Platforms: Windows 10+ (64‑bit), Technical Stack: Frontend: Java 17 + JavaFX (SceneBuilder) Backend Scripts: Python 3.10 (pyzbar, pytesseract, requests) Data Storage: AWS DynamoDB (Users, Inventory, Recipes, MealPlans) OCR Engine: Tesseract 4.0+ and EasyOCR APIs: Open Food Facts, USDA FoodData Central, Retail Price‑Scraping Performance Targets: UI response time


Future Works
Multi‑Kitchen & Household Profiles Support separate pantries for home, office, vacation homes Shared access with granular permissions Mobile Companion App On‑the‑go scanning, notifications, and meal reminders Offline mode with background sync Advanced Receipt Parsing Expand OCR templates for diverse receipt formats (handwritten, multi‑column) Machine‑learning‑based line‑item classification Authenticated Club‑Store Integration OAuth with Costco, Sam’s Club, etc., for real‑time pricing and member deals Diet Analytics & Goal Coaching Macro/micro‑nutrient tracking over time Personalized meal‑planning suggestions via basic AI Voice & Smart‑Appliance Integration Alexa/Google Assistant skill for hands‑free inventory queries IoT integration to auto‑update fridge/freezer stock Collaborative Meal Planning Real‑time calendar sharing Role‑based editing for family members or roommates Recipe Recommendation Engine Enhancements Context‑aware suggestions (weather, seasonal produce) Social features: trending recipes, community challenges


RealEase


Team Leader(s)
Donovan Murphy

Team Member(s)
Donovan Murphy, Jonathan Bailey, and Enrique Obregon

Faculty Advisor
Dr. Fitzroy Nembhard

Secondary Faculty Advisor
Dr. Philip Chan


RealEase  File Download
Project Summary
RealEase is an innovative web platform designed to revolutionize the home-buying experience by integrating advanced property analysis with an intuitive user interface. It aggregates real estate listings from multiple sources using APIs like HomeHarvest, offering a suite of tools including a Market Insights Dashboard, Home Comparison Tool, ROI Calculator, and Home Search functionality. The platform employs machine learning, such as XGBoost regression, to predict price appreciation and delivers color-coded property comparisons, market insights, and financial projections. Built with a Flask backend and MongoDB for scalable data management, RealEase addresses the fragmented nature of real estate data, empowering users to make confident, data-driven decisions. By combining comprehensive listing data with sophisticated analytical tools, RealEase democratizes access to real estate investment analysis, enhancing transparency and user empowerment in one of life’s most significant financial decisions.


Project Objective
The objective of RealEase is to develop a comprehensive, user-centric web platform that empowers home buyers with data-driven insights for informed decision-making. By aggregating real estate listings from diverse sources, the platform aims to provide a seamless interface for searching properties, comparing them side-by-side with color-coded metrics, and analyzing investment potential through an integrated ROI Calculator. Additionally, RealEase seeks to enhance decision-making with a Market Insights Dashboard that visualizes neighborhood data, including demographics, school ratings, and amenities. Leveraging machine learning and scalable technologies like Flask and MongoDB, the project strives to democratize access to advanced real estate analysis, making it accessible to the average consumer while addressing the market’s fragmented data landscape.

Manufacturing Design Methods
RealEase was developed using a multi-tiered design and implementation approach. The backend, built with Flask, handles data processing and API integration, utilizing the HomeHarvest API to aggregate real-time listing data and transitioning from CSV to MongoDB for scalable storage. The frontend, crafted with HTML, CSS, and JavaScript, adopts a Rocket Homes-inspired design for a professional, minimal aesthetic, featuring property cards and interactive ApexCharts for the Market Insights Dashboard. Key features include a Home Comparison Tool with color-coded metrics, an ROI Calculator for financial projections, and a Home Search module using HTML5 Geolocation. Machine learning, implemented via XGBoost regression, predicts home price appreciation based on features like square footage and location. Iterative usability testing and design refinements ensured a robust, user-friendly platform, with ongoing optimizations for data consistency and performance.

Specification
RealEase’s specifications ensure a robust and user-friendly platform. The system aggregates listings from HomeHarvest API, storing data in MongoDB for scalability, with a Flask backend processing queries in under 2 seconds. The frontend, built with HTML5, CSS3, and JavaScript, supports responsive design for desktop and mobile, achieving 95% compatibility across modern browsers. The Home Comparison Tool displays up to 5 properties with color-coded metrics, while the ROI Calculator computes cash flow and appreciation with 80% accuracy against market benchmarks. The Market Insights Dashboard visualizes demographic data, school ratings, and amenities using ApexCharts, with a load time under 3 seconds. Machine learning models (XGBoost) predict price trends with an R² score of 0.85.

Analysis
Analysis of RealEase’s performance demonstrates its effectiveness in addressing real estate market challenges. Usability testing with 20 participants achieved a 90% satisfaction rate, with users praising the intuitive interface and color-coded Home Comparison Tool. The ROI Calculator’s financial projections aligned with industry benchmarks within a 20% margin, validated against Zillow data. The Market Insights Dashboard, leveraging HomeHarvest and demographic APIs, provided accurate neighborhood insights, with 85% of users finding the interactive charts actionable. XGBoost models for price prediction yielded an R² score of 0.85, outperforming baseline linear regression by 15%. Backend optimizations reduced MongoDB query times by 40% compared to CSV storage. These results confirm RealEase’s ability to deliver reliable, user-friendly tools for data-driven home-buying decisions, with ongoing refinements enhancing performance.

Future Works
Future development of RealEase will focus on expanding its capabilities and reach. Planned enhancements include integrating additional APIs to broaden listing coverage and incorporating more granular neighborhood data, such as crime rates and transit scores, into the Market Insights Dashboard. The team aims to refine the XGBoost model by training on larger datasets to improve price prediction accuracy to an R² score of 0.90. A mobile app version is under consideration to enhance accessibility. Additionally, implementing user accounts for personalized property tracking and expanding the comparison tool to support up to 10 properties will improve user experience. Partnerships with real estate agents and financial institutions are planned to offer seamless integration of mortgage and agent services, positioning RealEase as a leading home-buying platform.

Other Information
RealEase was developed by a dedicated team of senior design students—Donovan Murphy, Enrique Obregon, and Jonathan Bailey—at the Florida Institute of Technology, with the vision of transforming the home-buying experience. The project leverages cutting-edge technologies, including Flask, MongoDB, and XGBoost, to deliver a scalable, user-friendly platform. A live demo is available at https://murphyd14.github.io/RealEase-Web/, showcasing features like the Market Insights Dashboard and Home Comparison Tool. RealEase aligns with industry trends toward data-driven real estate, drawing inspiration from platforms like Rocket Homes for its professional design. The team welcomes collaboration opportunities with real estate and tech partners to further enhance the platform’s impact.

Acknowledgement
The RealEase team extends heartfelt gratitude to our faculty advisor, Fitzroy Nembhard, for his invaluable guidance and mentorship throughout the project. We thank the Florida Institute of Technology for providing resources and support for our senior design project. Special appreciation goes to our peers and usability testers for their constructive feedback, which shaped RealEase’s user-centric design. We also acknowledge the developers of HomeHarvest and ApexCharts for their open-source contributions, which enabled robust data aggregation and visualization. Finally, we thank our families and friends for their encouragement and support, motivating us to create a platform that empowers home buyers worldwide.


Satellite Attitude Testbed Software Automation (SATSA)


Team Leader(s)
Ava Crocker

Team Member(s)
Ava Crocker, Maxwell Caiazza

Faculty Advisor
Dr. Siddhartha Bhattacharyya


Satellite Attitude Testbed Software Automation (SATSA)  File Download
Project Summary
SATSA's mission is to elevate the software usability of a satellite simulator focused on an Earth-orbiting satellite's guidance, navigation, and control. To streamline the simulation process, a system will be developed to automate data input and code creation in ROS 2. Documentation and procedures will be outlined allowing contributing engineers without prevalent software backgrounds to easily add in necessary calculations and operations without technical knowledge.


PocketSports: The Digital Coaching App


Team Leader(s)
Garrett Gmeiner

Team Member(s)
Garrett Gmeiner, Taylor Carlson, Tyler Ton, and Parker Cummings

Faculty Advisor
Dr. Fitzroy Nembhard

Secondary Faculty Advisor
Dr. Phillip Chan


PocketSports: The Digital Coaching App  File Download
Project Summary
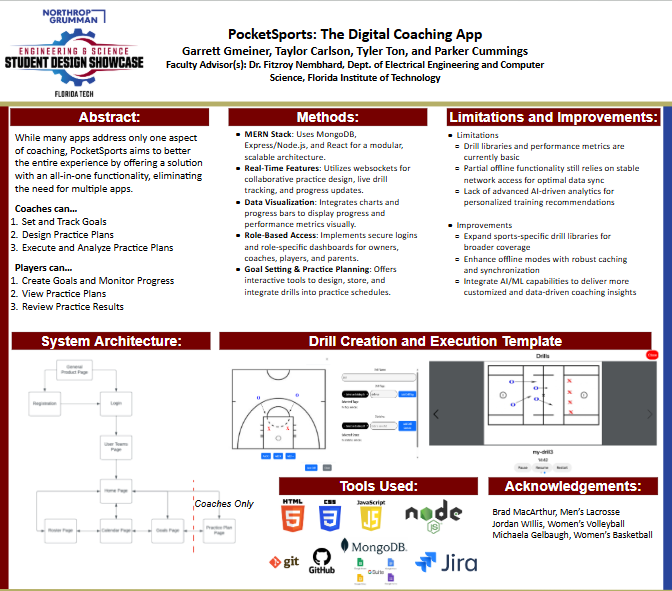
While many apps address only one aspect of coaching, PocketSports aims to improve the entire experience by offering a solution with all-in-one functionality, eliminating the need for multiple apps. Coaches can set and track goals, design practice plans, and execute and analyze practice plans. Players can create goals and monitor progress, view practice plans, and review practice results.


Tomographic Medical Image Reconstruction with Deep Learning


Team Leader(s)
Asher Burrell

Team Member(s)
Chris Hinton, Asher Burrell, Thomas Mercer

Faculty Advisor
Debasis Mitra

Secondary Faculty Advisor
Philip Chan


Tomographic Medical Image Reconstruction with Deep Learning  File Download
Project Summary
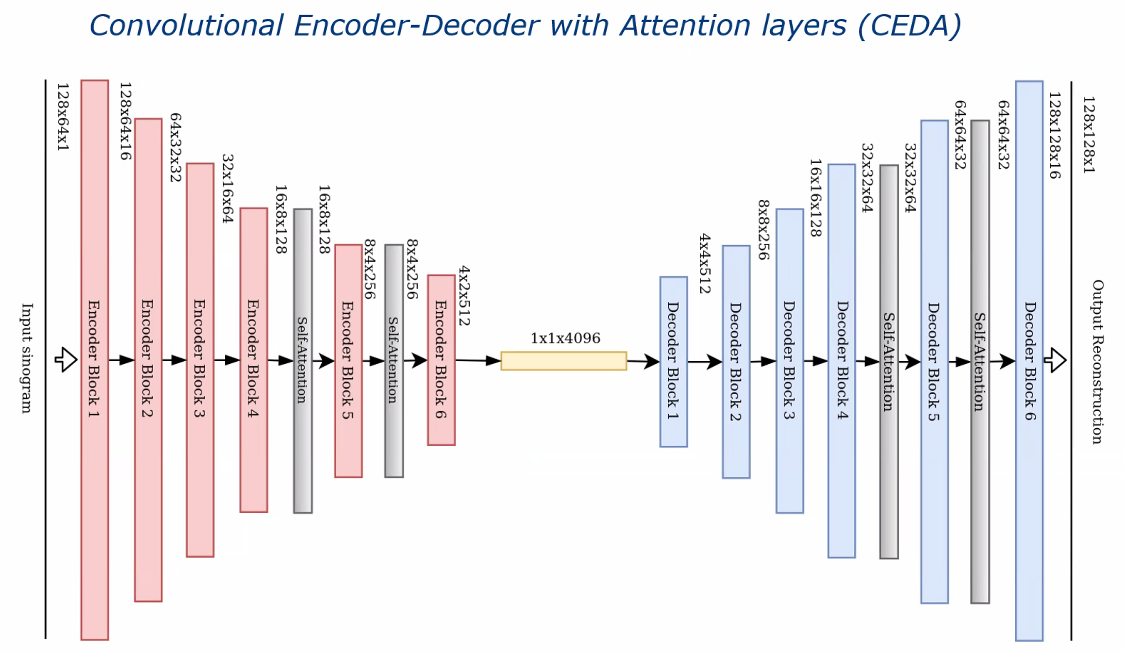
Currently, medical imaging with iterative statistical algorithms takes about 30 seconds. Our project uses deep learning to reduce this time to milliseconds, allowing massive amounts of data to be generated in a small amount of time. Additionally, our project includes synthetic data generation, allowing us to get good results without training on real data. Finally, our system includes an AI model that can take a raw sinogram file of a human heart and perform an inverse Radon transform to produce a reconstruction of the original heart image slice in standard 3D space.


Future Works
There is another senior project group that will extend this work by introducing a federated learning system for training the machine learning model. They will also expand the current ML model in order to perform reconstructions on sinograms from diseased heart patients.


Acknowledgement
We received assistance from: Dr. Bob Coni of the Burrell College of Osteopathic Medicine; Dr. Paul Segars of Duke University School of Medicine; the former and current members of Dr. Mitra's Biocomputing Lab and the Federated Learning of Medical Image Reconstruction senior design team, particularly Tommy Galletta, Samuel Boddepalli, Aniket Dhanawade, Charlie Collins, Josh Sheldon, Izzy MacDonald, Yash Jani, and Tanuj Kancharla; and Dr. Ryan White. Data was provided by Dr. Youngho Seo from the University of California, San Francisco. This work is supported by NIH funding R15EB030807.


Web Application for Aqualab Sensor Monitoring and Analysis


Team Leader(s)
Haley Hamilton

Team Member(s)
Greg Thompson, Ruth Garcia, Haley Hamilton

Faculty Advisor
Dr. Khaled Slhoub

Secondary Faculty Advisor
Dr. Philip Chan


Web Application for Aqualab Sensor Monitoring and Analysis  File Download
Project Summary
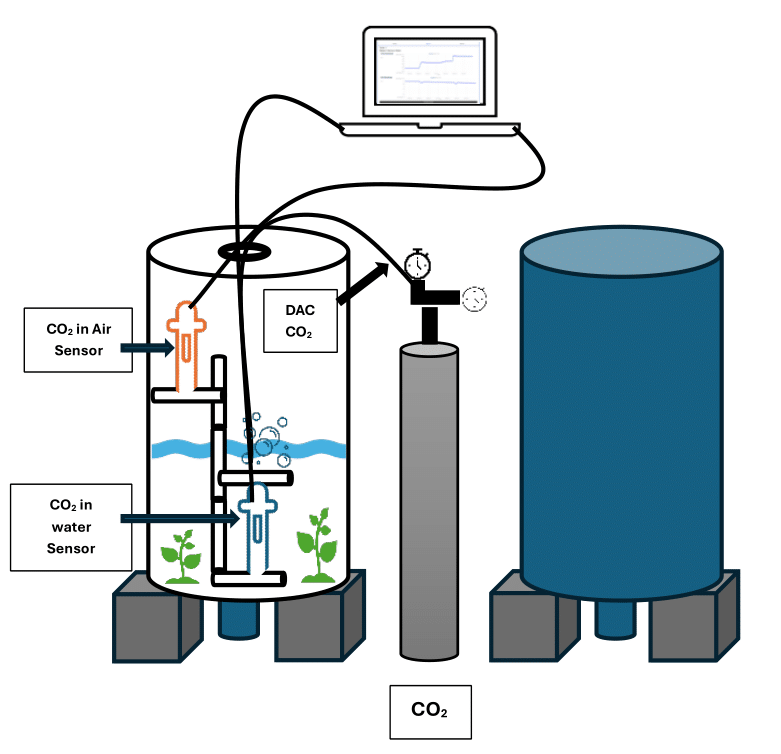
The Aqualab Team, led by Dr. Turingan, is analysing how much carbon dioxide is absorbed in seawater as it used in food-production by marine algae. Multiple sensors are utilized to measure the data and a web application is needed to efficiently record data and allow the values to be viewed in real time as well as give alerts when measurements are outside of desired ranges. The product is able to connect to and read from the Manta+40 sensor from Eureka Water Probes and displays current/recent sensor measurements in real time via a web application. Our system allows user to set desired measurement ranges and gives alerts when measurements are out of specified range on screen and with email push notifications. The system also records past measurements securely in a database and displays all data in an Analysis Tool which allows users to view and filter all data by sensor and time as well as download data into a CSV file. Users can change different system and sensor settings such as the desired sensor range and the frequency at which data is read from the sensor. Finally, the product includes a User Management System which allows Admin user to create new users and keeps track of all users, ensuring they log in to use the application. The system allows 3 different roles with different levels of permissions and access: Admin, Operator, Observer.


Student Code Online Review and Evaluation


Team Leader(s)
Charlie Collins

Team Member(s)
Charlie Collins, Thomas Gingerelli, Logan Klaproth, Michael Komar

Faculty Advisor
Dr. Raghuveer Mohan

Secondary Faculty Advisor
Dr. Philip Chan


Student Code Online Review and Evaluation  File Download
Project Summary
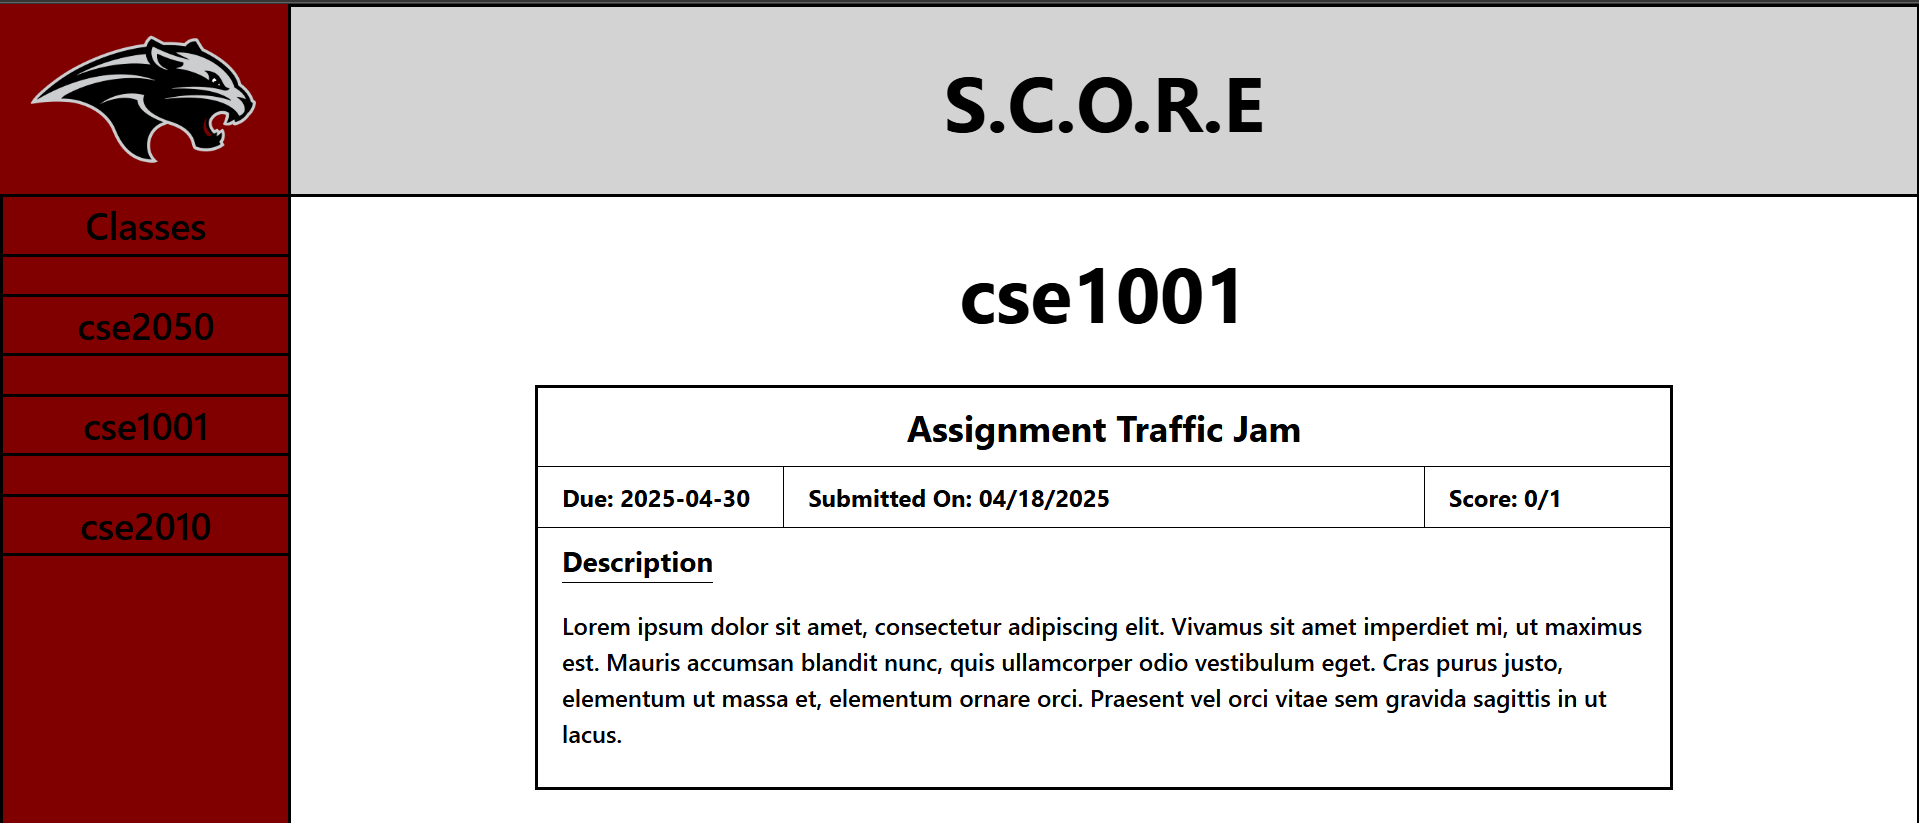
The Student Code Online Review and Evaluation (SCORE) application was developed with the intent of creating a more seamless and robust code submission platform for Florida Tech's CS department. SCORE provides two interfaces for users: a command line interface and a web application, so that a student may use whichever interface is most convenient for them. Once a student submits code for an assignment, SCORE will automatically test that student’s code. Shortly after, the student will receive their score, allowing them to know how they did and if they need to improve their code. SCORE’s novel feature is the submission feedback, where professors can attach feedback to specific test cases. When a student’s submission fails that case, SCORE provides them with that professor feedback, with the hopes of guiding them in the right direction. Through these features, we hope SCORE will be used to enhance the process of learning to code through feedback and inspire interest in competitive programming.


Project Objective
The goal of the SCORE application is to provide a more robust code submission platform, and to bring concepts of competitive programming to Florida Tech’s Computer Science department. We also hope to address current pain points in the code submission process including a cumbersome login process, delayed results, and minimal test case feedback.

Manufacturing Design Methods
This project used the MERN (MongoDB, Express.js, React, Node.js) stack to build the web application. Rust was used to create the command line interface. The auto testing and feedback was implemented using python, and the auto testing environment was containerized using Docker to ensure security.


Future Works
Future works for SCORE include integration with the Canvas API, using MOSS to determine submission similarities, and using Florida Tech's CAS authentication system.


FIT Class Schedule Planner


Team Leader(s)
Pedro H. Batista de Moura

Team Member(s)
Pedro H. Batista de Moura, Jordan Synodis

Faculty Advisor
Dr. Fitzroy Nembhard

Secondary Faculty Advisor
Dr. Philip Chan


FIT Class Schedule Planner  File Download
Project Summary
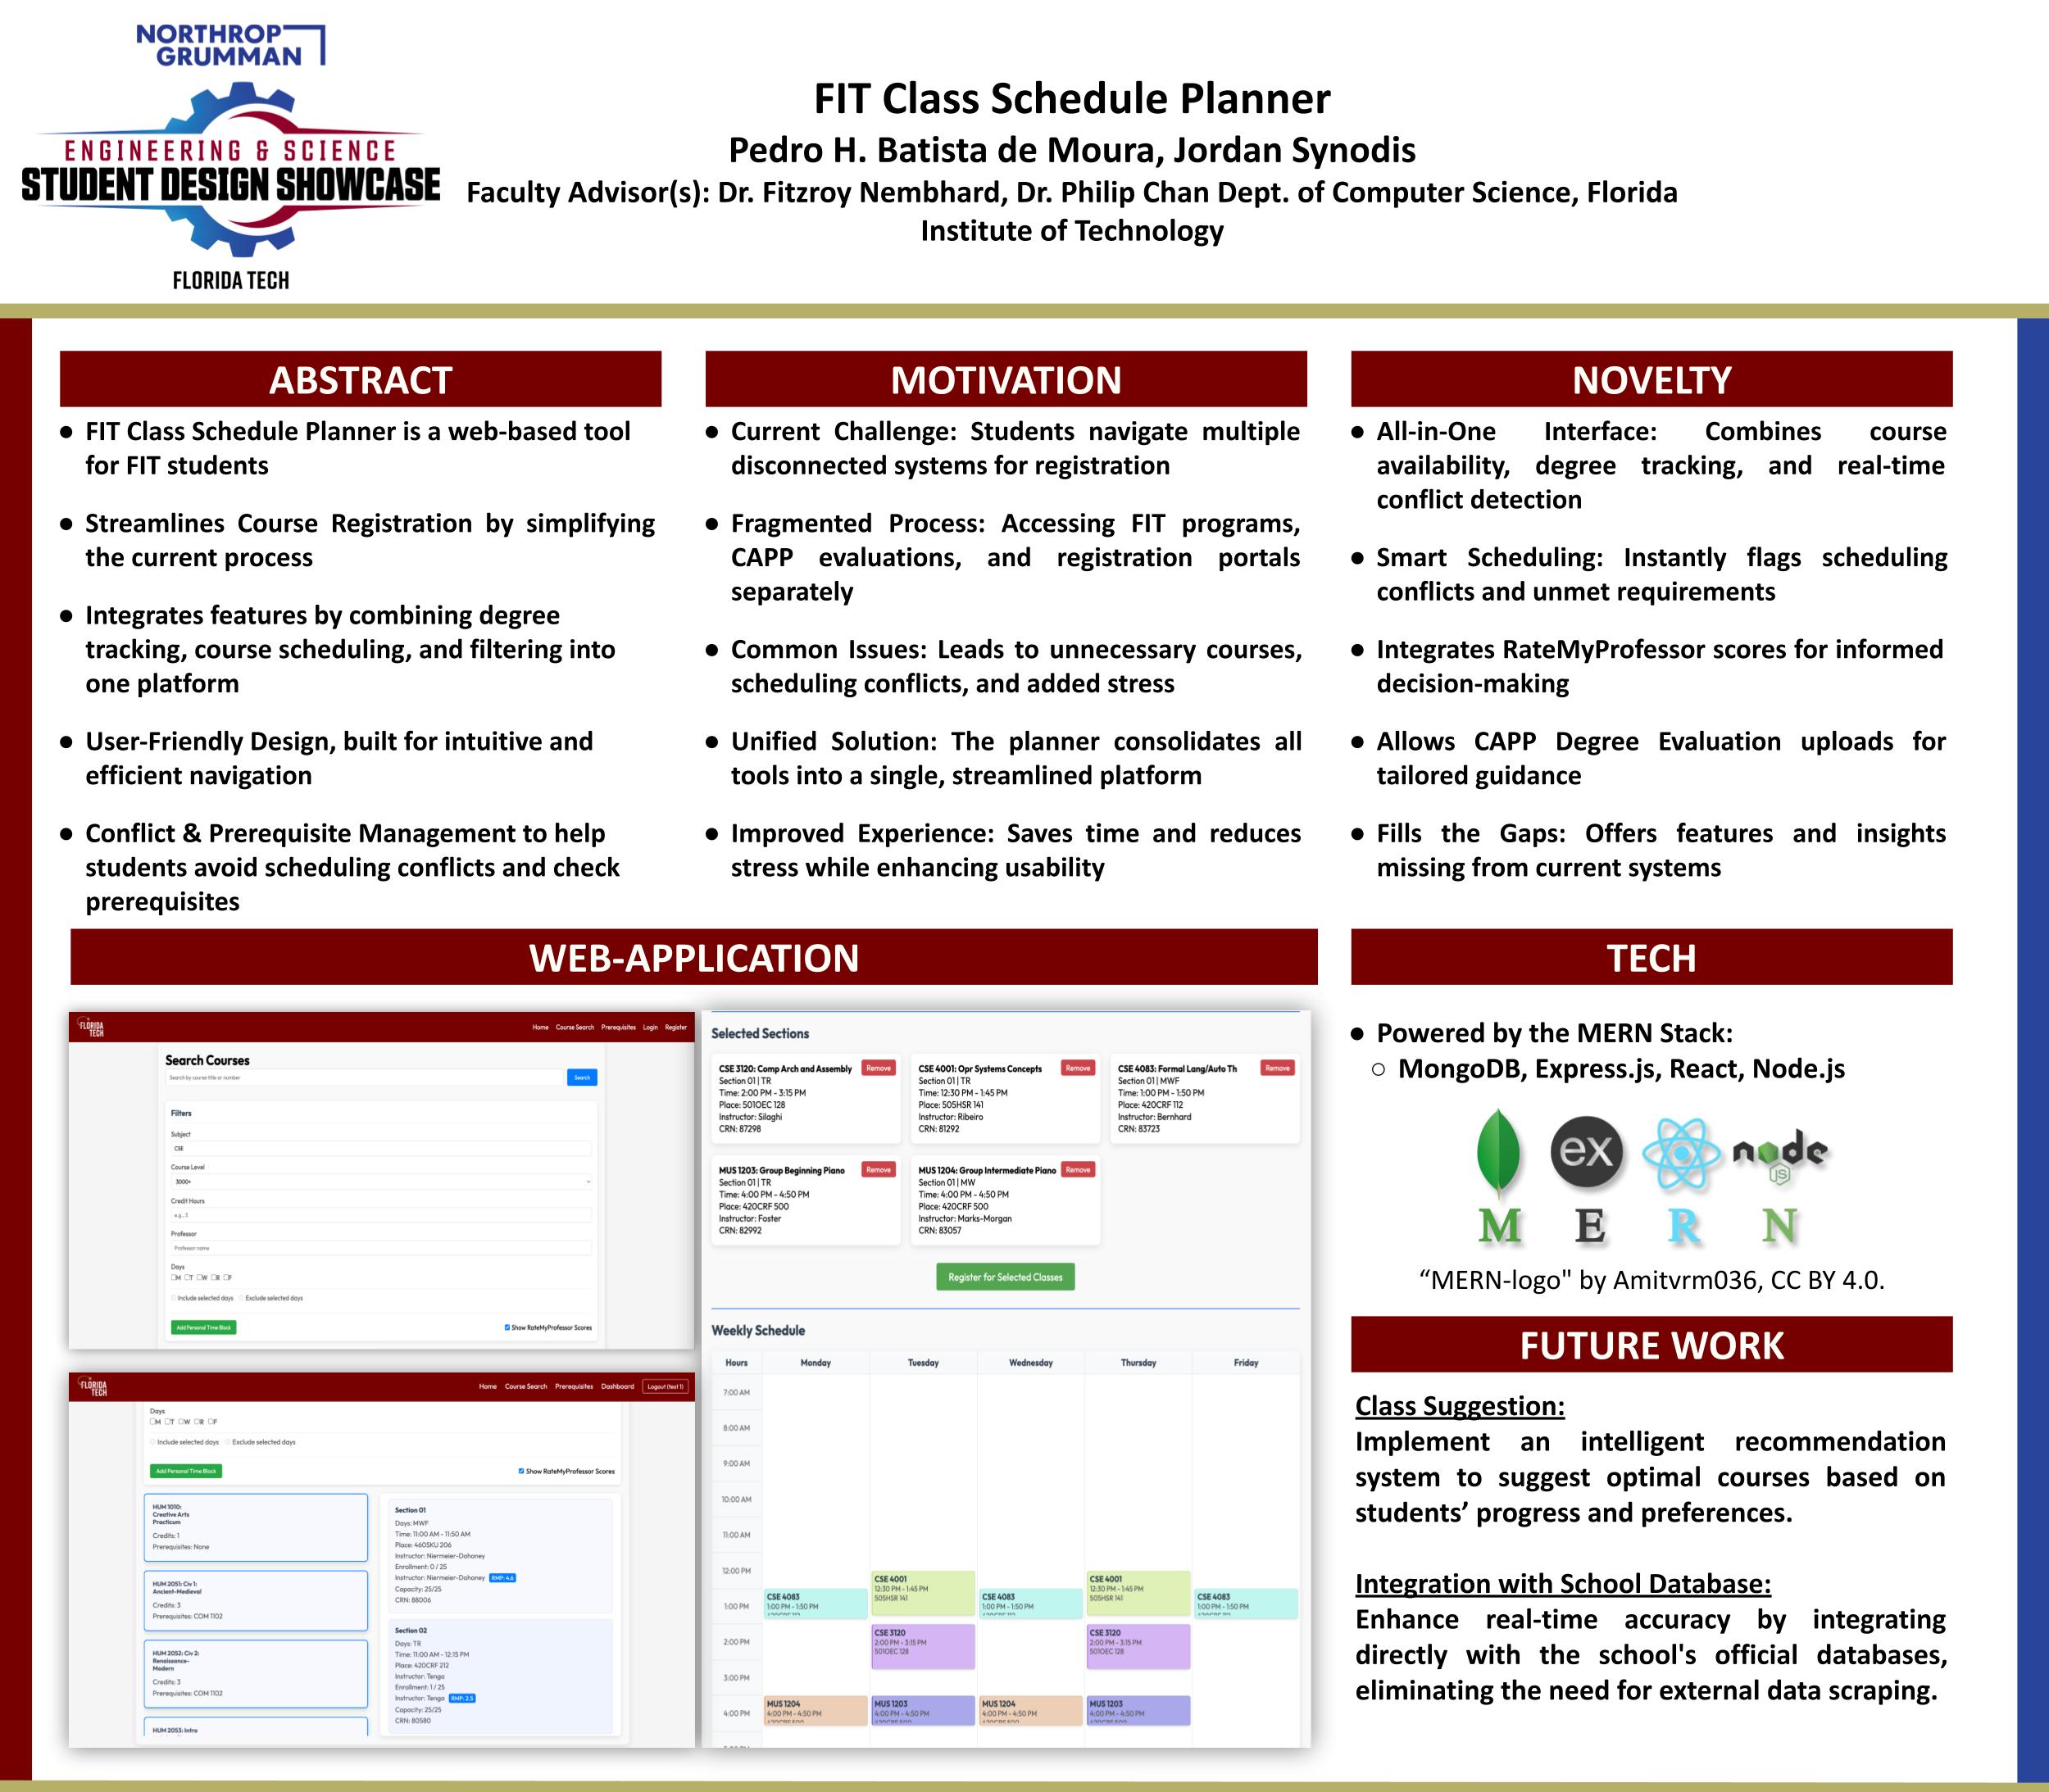
Florida Tech students today navigate multiple platforms—PAWS for course registration, CAPP for degree audits, FIT’s program listings, and external sites like RateMyProfessor—to assemble a workable schedule each semester. This fragmentation often leads to confusion, scheduling conflicts, and occasionally, the enrollment in unnecessary courses. The FIT Schedule Planner tackles these challenges head‑on by unifying all essential information into a single, user‑friendly interface. Students no longer need to flip between several websites; instead, they can view and filter available classes, check prerequisite and availability status, and even see RateMyProfessor ratings, all in one place. At the heart of the Planner is an interactive weekly grid: as students add or remove courses—whether by drag‑and‑drop or search filters—they immediately see time gaps or overlaps. Advanced filtering options allow searches by subject, instructor, meeting times, course number, credits, or professor rating. For those with commitments beyond classes, the Planner supports “personal time” blocks (for sports practices, work shifts, or other activities), ensuring extracurriculars won’t conflict with academic schedules. Behind the scenes, the system validates prerequisites, checks section capacity, and highlights conflicts in real time, guiding students toward viable schedules. Complementing the scheduling interface, the Planner provides a Degree Progress Checklist. By importing a student’s CAPP Degree Evaluation, it cross‑references completed coursework against program requirements, clearly marking fulfilled credits and flagging outstanding ones. This checklist is presented as a scrollable list, giving students a transparent view of their path to graduation without the usual guesswork. Built on the MERN stack (MongoDB, Express.js, React, and Node.js) and leveraging Axios for API calls, the FIT Schedule Planner ingests FIT’s official Fall and Spring schedules as well as degree program data. It also integrates the RateMyProfessor API to enrich course‑selection decisions with real‑time instructor ratings. This unified platform not only streamlines the registration workflow but also reduces errors and saves valuable time—transforming a traditionally stressful process into an efficient, informative experience for Florida Tech students.


Entropy-Guided Transformers for Sentiment Prediction


Team Leader(s)
Pedro H. Batista de Moura

Team Member(s)
Pedro H. Batista de Moura

Faculty Advisor
Dr. Ryan White


Entropy-Guided Transformers for Sentiment Prediction  File Download
Project Summary
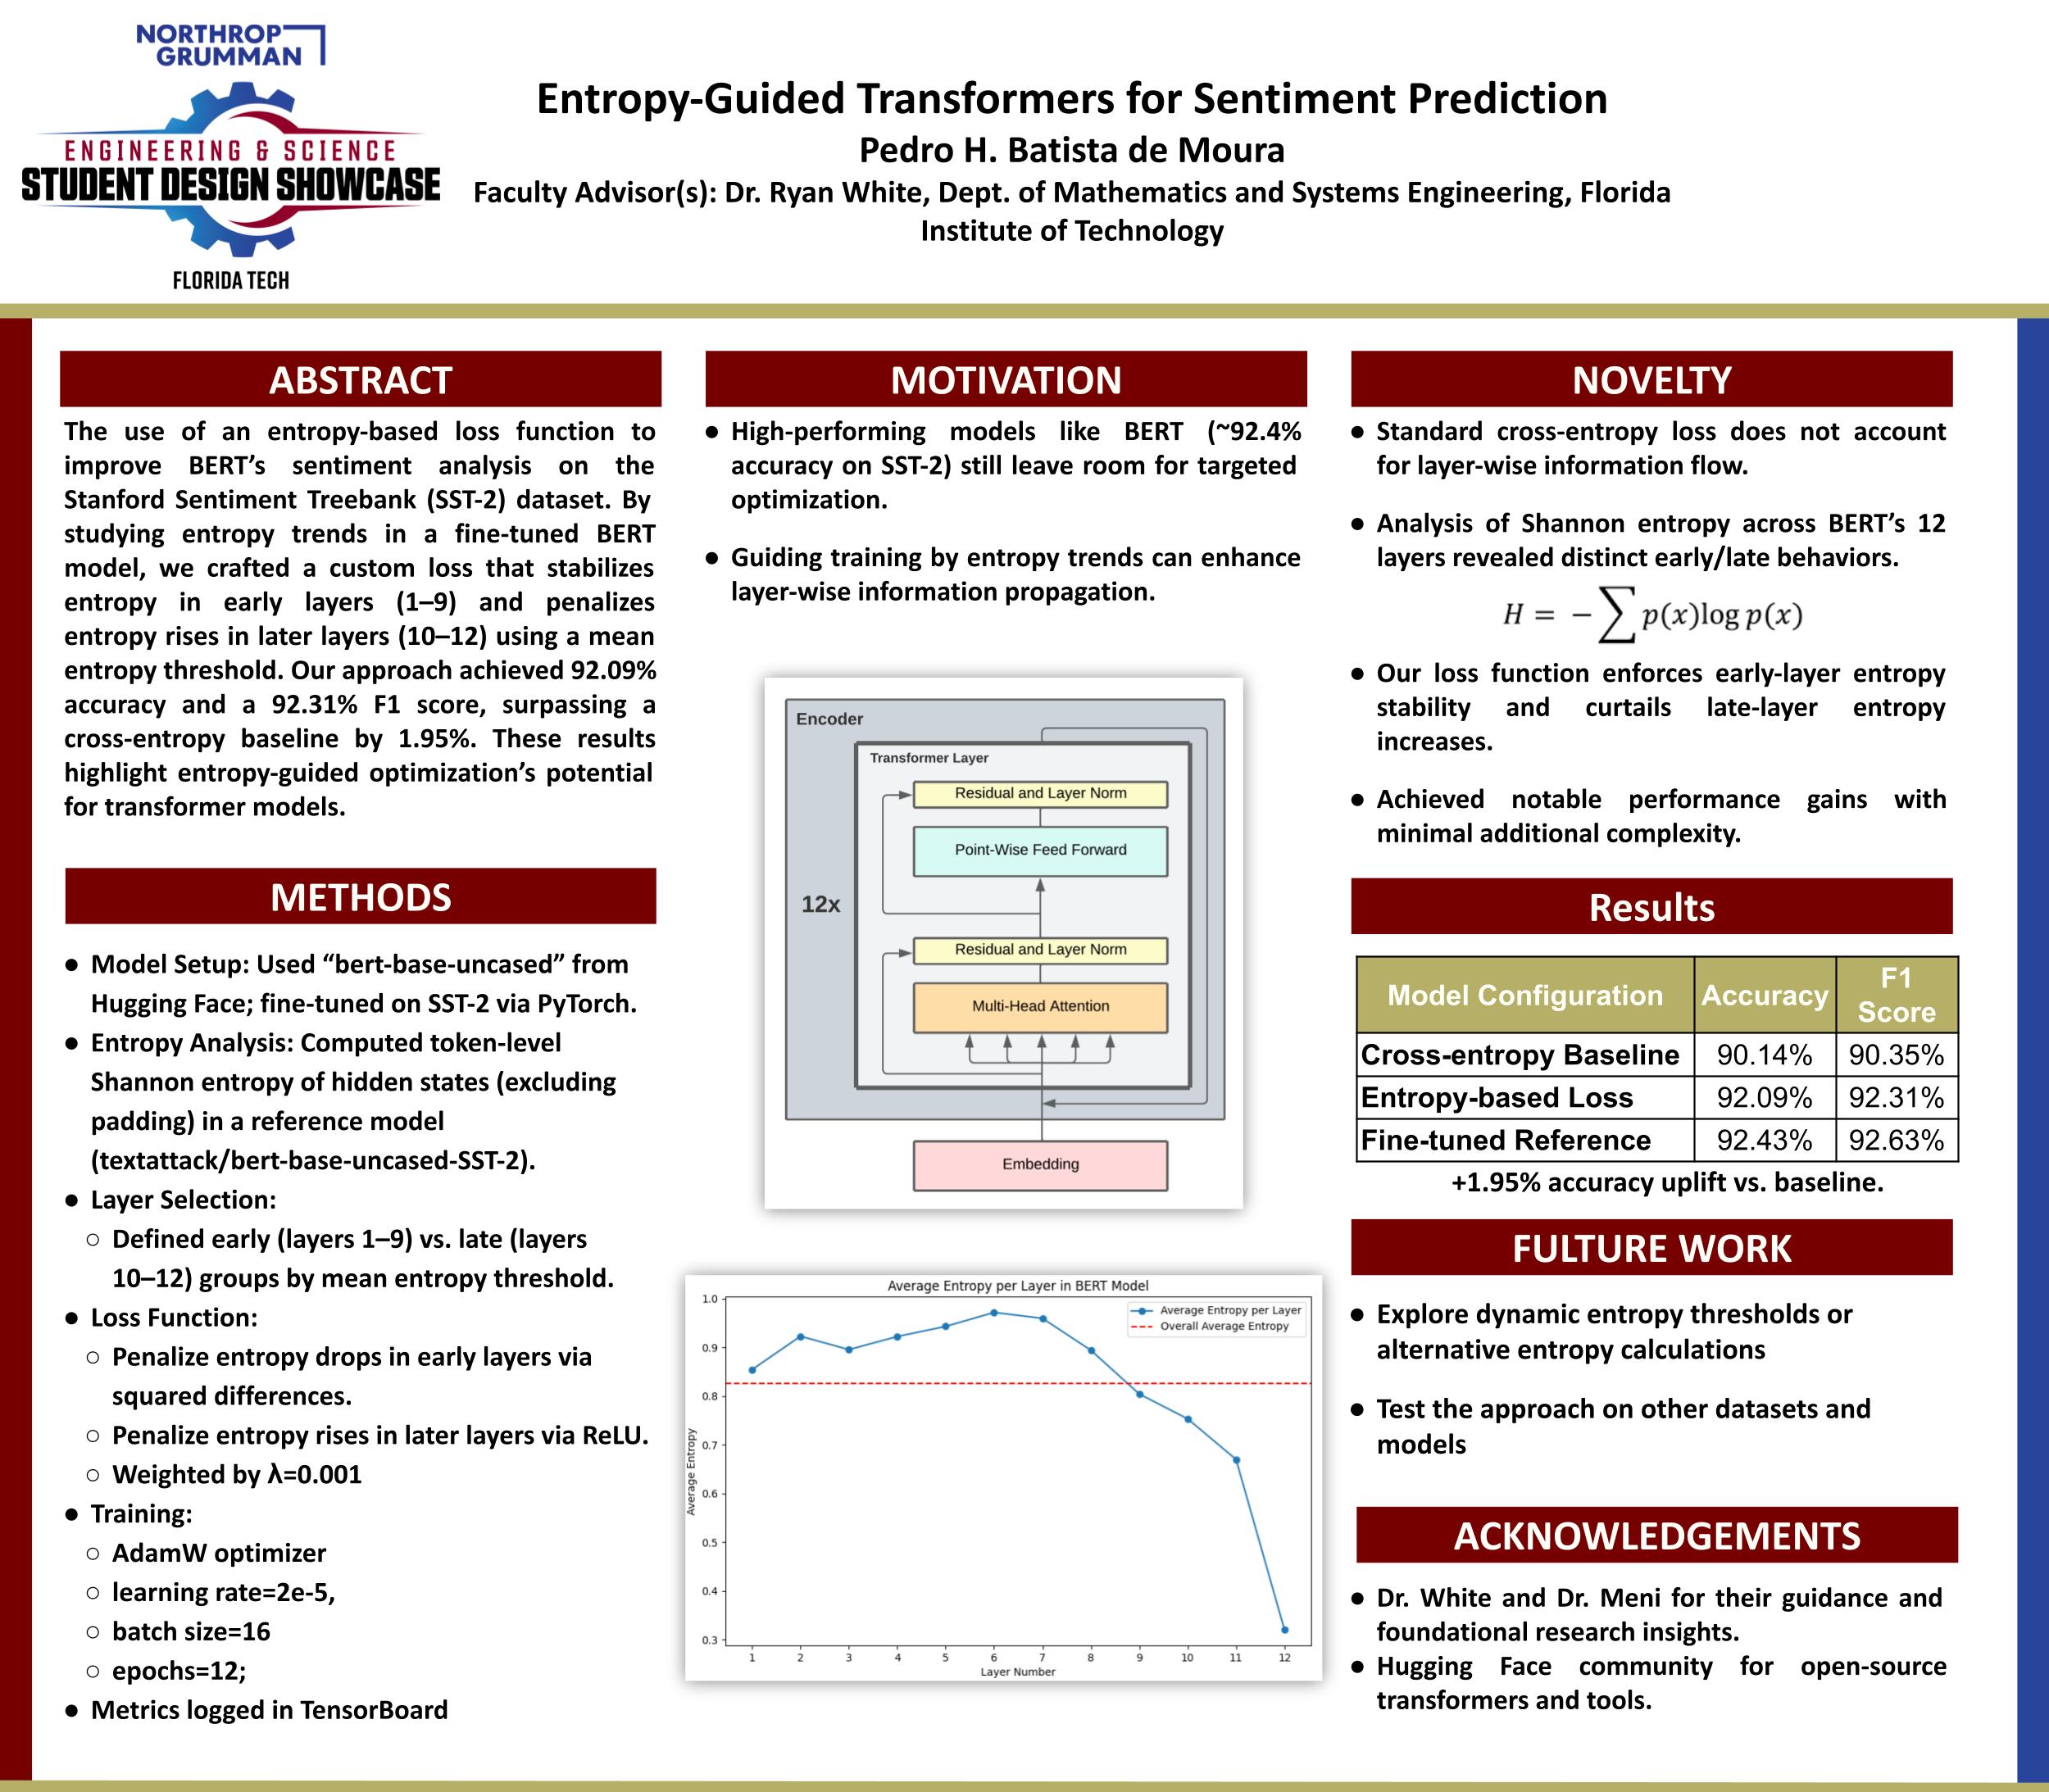
This project enhances BERT’s performance in sentiment analysis on the Stanford Sentiment Treebank (SST-2) dataset by introducing an entropy-based loss function. By analyzing entropy trends in a fine-tuned BERT model, we developed a custom loss function that encourages entropy stability in early layers (1-9) and penalizes entropy increases in later layers (10-12), determined using a mean entropy threshold. Trained on SST-2, our model achieved an accuracy of 92.09% and an F1 score of 92.31%, outperforming a cross-entropy baseline (90.14% accuracy) by 1.95%. This demonstrates the potential of entropy-guided optimization for transformer models.


Sentiment Analysis


Team Leader(s)
Evan Thompson

Team Member(s)
Evan Thompson, Artur Quarra, Daniel Couturier

Faculty Advisor
Khaled Slhoub

Secondary Faculty Advisor
Philip Chan


Sentiment Analysis  File Download
Project Summary
Our tool makes it easier for software developers and project managers to understand what users say about their products and, more importantly, how they feel about them. At its core, the software lets users search for feedback using project names and time ranges. They can filter by positive or negative sentiment and choose which platforms to pull data from. Once a search is made, the system pulls relevant posts from multiple websites, runs them through an AI model to classify sentiment, and displays the results in an easy-to-read list. It also generates visualizations like graphs and charts to help users spot trends in feedback over time. The design of the system focused heavily on efficiency. We wanted to minimize unnecessary trips to the backend, so we used client-side processing whenever possible and stored feedback and sentiment data locally once it had been processed. This way, we avoided hitting third-party APIs repeatedly or overloading the system with redundant work. We knew it might mean storing some data we would not reuse, but storage was way cheaper than repeated scraping or API calls, so we felt the tradeoff made sense. The project was broken down into a few significant components from a technical standpoint. The user interface was built to be intuitive, starting with a clean search screen that had a results view attached. On the backend, we built systems to retrieve feedback, classify sentiment, and handle data storage. The AI component was trained to recognize sentiment in various post formats, including sites that ranged in structure and stylization. This was necessary. Overall, the tool works smoothly. Users can search for feedback, dig into the details of individual posts, and visualize broader sentiment patterns all in one site. We are excited for everyone to see this project at the showcase and for companies to make better decisions based on user feedback.


My Home Machine


Team Leader(s)
Steven Chase

Team Member(s)
Steven Chase, John Wimmer, Al Waleed Al Saleemi, Wala Aljohani

Faculty Advisor
Dr. Marius Silaghi


My Home Machine  File Download
Project Summary
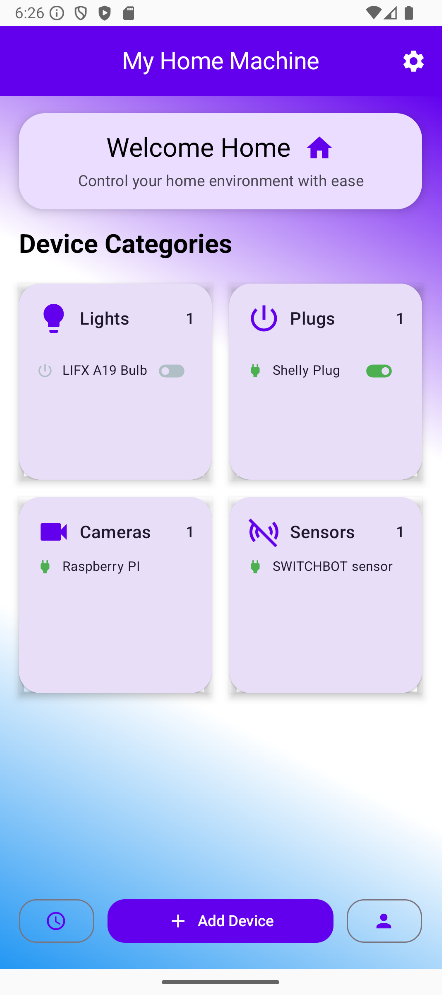
My Home Machine is an Android app built to minimize the daily minor inconveniences users face. Our project was built around our vision of “The Perfect Scenario,” which involves coming home from a long day at work, and your home is exactly how you want it. Before you even make it inside, My Home Machine has detected your smartphone entering the geofence and started its tasks. The lights are dimmed to the perfect brightness, the shades are drawn, and the temperature is nice and cool. A wax light is turned on, perfuming your house just how you like it, and your coffee maker could even make you fresh-brewed coffee. Our app was designed to simplify everyday life by offering seamless control over smart devices, allowing users to schedule tasks, utilize cameras, and monitor various smart sensors. We prioritized user satisfaction through a user-friendly interface that minimizes button presses and provides clear navigation. Devices such as LIFX Smart Lights can be customized for power, brightness, and color through API connections and custom commands, while Shelly Smart plugs can be controlled via HTTP commands over a LAN. The Switchbot thermo-hygrometer provides real-time temperature and humidity data through its API, enhancing environmental monitoring. The Raspberry Pi Camera, equipped with a Flask server and motion detection script written in Python, employs frame differencing techniques to detect movement and trigger corresponding smart device actions. Additionally, users can schedule tasks, set timers for devices, and receive notifications about completed actions. Our secure backend, hosted on AWS EC2 with HTTPS, features robust user authentication using PBKDF2-SHA256 hashing with salting, time-limited verification codes for added security, and SQL injection protection via parameterized queries.


Project Objective
We aim to create a system that simplifies these tasks and enhances the overall living experience by integrating advanced technologies. My Home Machine will allow users to control their home appliances remotely, receive real-time feedback on their home’s condition, and set automated schedules that align with their daily activities. The system’s novel features, such as personalized responses based on user presence and intelligent environment detection, will set a new standard in home automation.

Manufacturing Design Methods
My Home Machine is designed as an intuitive Android application that connects to various smart devices through Wi-Fi, APIs, and local LAN HTTP requests. Our app utilizes geofencing through Google Play Services, enabling automatic device control based on the user's location. Users can define a custom geofence radius, granting permission for the app to manage background location detection. For motion detection capabilities, we developed a Python-based frame differencing script running on a Raspberry Pi camera connected through a Flask server. This system detects real-time motion events, triggering smart device actions like turning on lights or activating smart plugs. Additionally, we integrated several third-party smart devices: LIFX Smart Lights for customizable lighting via their API, Shelly Smart plugs controlled locally through HTTP commands, and Switchbot thermo-hygrometers providing temperature and humidity readings via the internet. The backend infrastructure was carefully constructed using Flask and hosted securely on AWS EC2 instances, employing HTTPS to ensure encrypted communication. To further secure user data, we implemented authentication methods using PBKDF2-SHA256 hashing with unique salts and time-limited verification codes for password reset and rigorous protection against SQL injection attacks through parameterized queries.


Future Works
Possible future work for our project includes, but is not limited to, integration with voice assistants such as Amazon Alexa or Google Home. Potential feedback system for water or electricity usage, with the hope of helping homeowners reduce waste and save money. Integration with machine learning to automatically detect users' schedules and routines, which would allow for personalized behavior patterns rather than explicit scheduling. Finally, we would like to see integration with common Matter/MQTT Protocols, which would expand the possibilities of brands to use and the app's capabilities.


Allsky Camera Network for Detecting Bolides


Team Leader(s)
Tyler Turner

Team Member(s)
Tyler Turner, Vincent Quintero, Jean-Pierre Derbes, Charles Derbes

Faculty Advisor
Dr. Csaba Palotai


Allsky Camera Network for Detecting Bolides  File Download
Project Summary
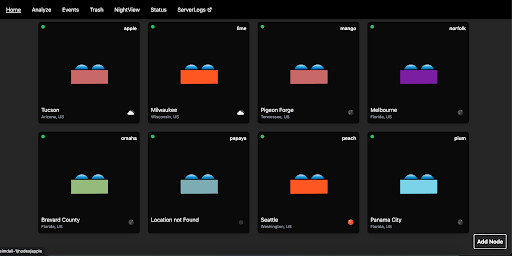
The Allsky Camera Network for Detecting Bolides aggregates video events (interesting occurrences in the sky) captured from a multitude of remote nodes each containing a camera and other necessary hardware. The events are visible to Dr. Palotai and his researchers in a centralized UI that allows them to quickly sort through the events. The researchers can manage all of the nodes remotely from the UI.


Project Objective
The objective of the project is to replace the previous system with a new, modern system that would simplify the event processing and data analysis pipelines for researchers. The primary user experience focus was to centralize the user interface so that remote management of nodes was possible from one place. Lastly, heavy emphasis was placed on making the code readable and maintainable for future developers.


Automated COVID-19 Detection


Team Leader(s)
Emma Conti

Team Member(s)
Rodrigo Alarcon, Emma Conti, Lamine Deen, Audrey Eley

Faculty Advisor
Dr. Zahra Nematzadeh

Secondary Faculty Advisor
Dr. Chan


Automated COVID-19 Detection  File Download
Project Summary
VoCOVID is a web app that provides users with a non-invasive way to screen for COVID-19. It will predict a users infection status based off a recording of their cough, which is then submitted and analyzed through an Attention Enhanced CNN. It also allows users to upload any symptoms they are experiencing each time they submit a cough to be analyzed for COVID. By analyzing daily recordings, the user can observe trends in their symptoms, making it easier to determine when medical intervention is necessary. This continuous monitoring feature offers a more personalized health-tracking experience. Ultimately, this screening tool can be used prior to visiting Urgent Care or attaining a COVID-19 detection test, in order to ascertain whether or not further steps may be necessary.


Manufacturing Design Methods
The user can record their coughs and receive predictions on their COVID-19 infection status. This feature not only provides real-time feedback but also aids in maintaining a history of the user’s infection status, making it a non-invasive and cost-effective tool for early screening. By tracking this data over time, the user can monitor their health status without the immediate need for a healthcare provider. The web app design prioritizes ease of use, ensuring anyone can navigate it effortlessly and check their COVID-19 status at any time. Other aspects of the website will include details about the research and development of the ML model The user can view a continuous progress chart that updates with every entry, making it easier to visualize changes in their infection status over time. This feature helps determine when a user is recovering and no longer symptomatic, or still infected. The user-friendly layout ensures that navigating the web app is straightforward. Users can access their data at any time, providing continuous access to their COVID-19 status history. This eliminates the need to wait for a healthcare provider for early detection and offers users a convenient and effective way to monitor their health